Note: This is a guest post by Neil Kay. It is part of a chapter that he is writing for a book that I am editing with David Rooney and Greg Hearn called Handbook of the Knowledge Economy, volume 2. We’ll post Neil’s chapter as he writes it over the next few weeks. I’ll do the same with mine, which is seriously overdue too. – Tim
COMMENT FROM NEIL KAY
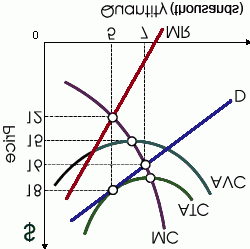
I puzzled some UQ MBAs in a guest seminar last year by telling them that I occasionally tried to become a better teacher by reading Economics textbooks upside down. While I would very much welcome comments on all the half dozen or so threads I plan to post for my article, I really would especially appreciate feedback on this thread as to whether it is on to something, or whether I should just keep taking the tablets.
-Neil
The complexity of economics and the Paradox of Mankiw
This is not a linear narrative and it is work in progress – I am going to jump to Thread 4 (or it might turn out to be Thread 5) in the story I told in my first post (“What does a knowledge economy actually look like?”). In that post I noted what I thought Mankiw lacked. In fact, having taught introductory first year economics using Mankiw’s book, I see it as being itself a superb example of how to succeed in a knowledge economy. For example, the standard monopoly problem in textbooks invokes all of the well-known AVC, AFC, AC, MC, MR and AR curves. Only certain curves have relationships between them or at least relationships that matter for pedagogic purposes (for example: AR and AC for profit; MC and MR for profit maximizing). The problem for a beginning student is that they have no mental map to tell them which pairs or combinations of curves have relationships that are significant in economic terms, and which do not (which is why many students often try valiantly in their exercises to get as many curves as possible intersecting at one point in the hope that at least some of the intersections reflect valid relationships).
If you want to experience an approximation to this tabula rasa effect yourself, turn an Economics textbook upside down and look at individual diagrams. Even experienced economists who do this tend to see a bewildering maze of lines, which is close to how a beginning student sees it.
One way to think of such curves is as members of a network in which each member may (or may not) have relationships (links) with other members of the network. For the beginning student lacking filters to sort out which of these are significant relationships, one measure of the complexity of the diagram (or network) is the total number of potential or possible relationships between curves in the diagram (or links between members of this network). For a monopoly diagram with all six curves (AVC, AFC, AC, MC, MR and AR) the total number of potential relationships or links1 between members of this network is 15 (or 5+4+3+2+1).
But if the monopoly diagram is split into two diagrams for the beginning student, say one with AVC, AFC, AC, MC and one with AC, MC, MR and AR, then the total number of potential relationships between curves (links between members of the network) in each diagram reduces to 6 (or 3+2+1). That is a total of 12 potential relationships for the two 4-curve diagrams which in total is still less complex for the beginning student than the single 6-curve diagram. An experienced teacher knows that these two diagrams contain most of the relationships they want to talk about, which is why experienced teachers tend to use at least two diagrams here instead of one, at least to begin with.
I have a theory that if you used such a measure to assess the complexity level of first year Economics lecturers’ PowerPoints that they would inversely correlate with teaching evaluations – but that has not been subject to empirical testing.
Which is why Mankiw is a very good teacher and his textbook is a best seller. I do not know if Mankiw used a similar rule of thumb intuitively or explicitly, but his text is constructed as if he did. Most standard introductory texts are not shy about inflicting diagrams or figures with very high levels of network complexity on beginning students. But Mankiw has as few curves as possible in his figures, usually no more than 3 or 4. Indeed, in my edition there are only four figures with 5 curves and no figures with 6 curves or more. So here is another paradox; at the same time that Mankiw is doing the standard first year Economics textbook thing of describing “the economy” as one largely devoid of knowledge activities, his text may be regarded as indicative of best practice knowledge activity in a knowledge economy. The paradox of Mankiw is that in the economy he describes, his book would not exist.


Please note: I reserve the right to delete comments that are offensive or off-topic.